RESEARCH QUESTION AND HYPOTHESES
When conducting mailback surveys, academics and market researchers must estimate response rates in advance in order to predict the total expected usable responses resulting from a number of mailed questionnaires (and hence to budget their study). Our hypothesis is that, ceteris paribus, the response rate will be inversely proportional to the survey response burden, the level of commitment of the respondents, and the presence of a monetary incentive. Our work is, to our knowledge, the first to quantify this link for the response burden of an instrument, and therefore the first to enable the survey designer to trade off the burden against the response of a survey.
We report results for two types of response rates: Response rate of the share of responses among the total sample (R1) (using the American Association for Public Opinion Research [2016] definition) and response rate of the recruited/committed respondents completing the survey among those who had explicitly agreed to participate (R2).
There is little literature to help in predicting the response burden and corresponding response behavior. There is a large body of literature discussing response rates, the factors influencing them, and the various impacts on survey quality. While the literature on survey methods for paper-based instruments discusses response burden, it does not measure it in detail (see Richardson, Ampt, & Meyburg, 1995; Dillman, Smyth, and Christian, 2014 for relevant textbooks; or the Transportation Research Board wiki). Response burden approximated as the number of pages (or questionnaire length) has a significant influence on the response rate (see also a similar measure in Bruvold and Comer, 1988). Later reviews find the same effect, but do not measure the burden in detail (see Edwards et al., 2002). Current literature on web-based instruments is equally large, but again it misses an a priori measure of the response burden. Bartel-Sheehan (2006), in her review of email questionnaires, finds a clear effect from the number of questions, but does not differentiate by question complexity.
METHODS AND DATA
The response burden (B) is measured with the scheme in Table 1, question by question in an efficient and reproducible way, also accounting for the type and complexity of questions (Axhausen, Schmid, and Weis 2015). Points are added up, such that longer and/or more complex instruments exhibit higher total response burden scores (see also Table 2). Note that twelve points roughly correspond to a one-minute response time (Schmid, Balac, and Axhausen 2018).
The original point system is used to budget face-to-face interviews at the Zürich-based Gesellschaft für Sozialforschung. Ursula Raymann (GfS, Zürich) and later the authors rated the self-administered surveys (Table 2) of the Institute for Transport Planning and Systems (IVT). The current available sample of 68 survey waves including pre-tests (resulting from 35 studies) allows us to test and quantify the stated hypotheses.
The following logistic regression model is estimated for the three groups (“no prior recruitment, no incentive”, “prior recruitment, no incentive” and “prior recruitment and incentive”, denoted by subscript i) including weights to capture the number of potential respondents (i.e., who received the questionnaires) in each survey wave and controlling for a global time trend (Y; starting at zero for the year 2004) in response behavior:
log(Ri100−Ri)=αi+βi B1000+τ Y+εi
The Logit transformation e.g., (Winkelmann 2006) is applied to the response rate (R) mainly to solve the boundedness problem of the dependent variable (i.e., the probability of participation in a survey; see also Schmid, Balac & Axhausen, 2018). Clustered standard errors are calculated at the study level e.g., (Baltagi 2008).
FINDINGS
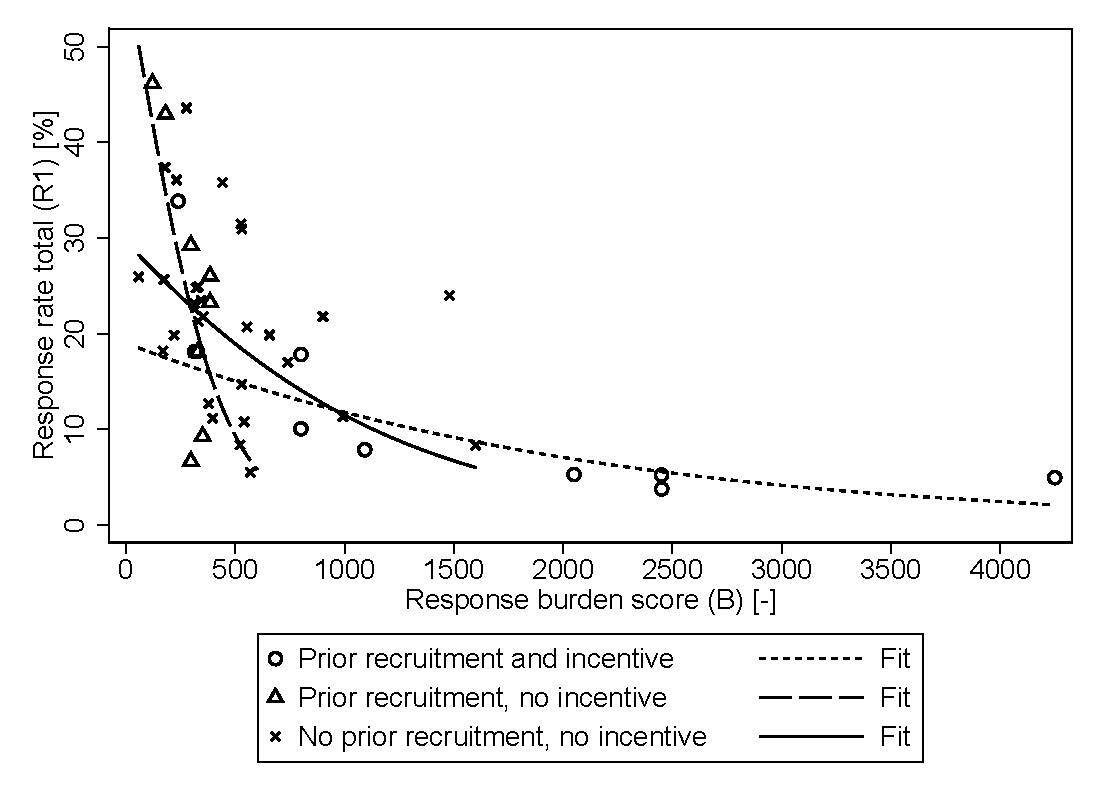
The results confirm our hypotheses for both types of response rates. Table 3 shows the results of the logistic regressions (see also Figure 1 and Figure 2). A pooled model for R1 is added for comparison; for an increase in response burden (B) by 100 points, the expected decrease in the odds of participating in a survey is given by = 6.0% (p < 0.01). Furthermore, decreasing the age of the study by one year is decreasing the expected odds by 6.8% (p <.05), indicating a general trend of a lower willingness to participate in surveys.
The effect of the response burden in the pooled model averages across the three groups but hides the substantial differences shown in the case-specific analysis. Importantly, an AICc comparison indicates that the fit of the full model (different slope coefficients) is slightly better. While the number of observations is too small to obtain confident statements for all categories, the patterns are clear. The lower share of respondents, those who begin a “cold-call” survey, are then committed to it, and the effect of the response burden is comparable to the respondents which were recruited and offered an incentive. The pattern for the recruited respondents without incentives is reversed: A higher share of respondents start, but there is a dramatic drop in response with an increasing response burden. It should be noted that the incentives were offered for high response burden surveys to overcome this hurdle in recruitment. The results for R2 confirm that the effect of the recruitment is not strong enough to balance the response burden.
To further validate these results, they would need to be replicated by other research groups with the studies available to them. We will continue to expand our sample, but the IVT group will never have enough studies to be confident about the generality of our estimates and we are tied to our social context and subject area with its specific saliency to the respondents (Groves, Presser, and Dipko 2004). Nevertheless, as a first guess the results should allow designers elsewhere to trade-off survey burden versus response and should improve the budgeting substantially.
ACKNOWLEDGMENTS
The authors are very grateful for the rating of the first set of surveys by Ursula Raymann, GfS Zürich, and for making the initial rating scheme available to us.
The article builds on Axhausen and Weis (2010) and Axhausen, Schmid, & Weis (2015).


